
Grid Connections Automation Suite.
The suite automates dynamic simulation studies on both PSS®E (RMS) and PSCAD (EMT). It takes a high-level definition of the studies to run and carries them through initialisation, execution, and post-processing and plotting. The engineer defines each study once. The suite sets up the cases, runs them across the available computing resources, and returns annotated, review-ready results. A common test definition drives both platforms, so results are directly comparable.
Highlights

Initialisation.
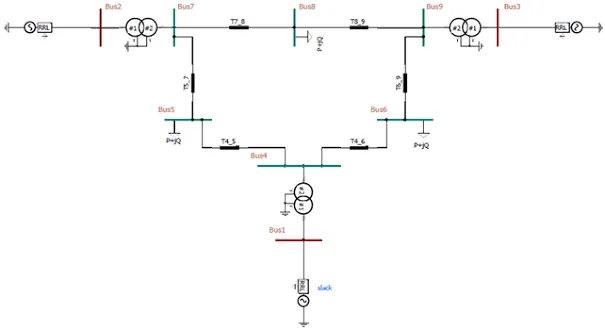
Each test is a fully specified simulation. It sets the pre-disturbance operating point: active and reactive power at the point of connection (POC), voltage at the slack bus and POC, initial frequency, and grid strength. It also sets the simulation platform, the plant control scheme, and the disturbance: type, fault depth, timing and phase combination. Each model is then automatically brought to its specified operating point before the dynamic run begins. Every test also carries its own duration and time step, which set simulation length and fidelity. Finally, tests are organised into sets so that the execution stage can make the best use of the available hardware.
Simulation Execution.
Execution is managed separately for PSS®E and PSCAD, with the aim of keeping every available core busy and minimising total completion time. Tests are batched and run in parallel in a way suited to each platform's resource demands. Cases of similar duration are grouped together so that no core sits idle waiting on a longer run. Results are processed as the run progresses, and a failure in one test does not stop the others. The native outputs of both solvers are converted into a common, human-readable format, with test metadata attached. Everything downstream therefore treats the two platforms identically.
Analysis.
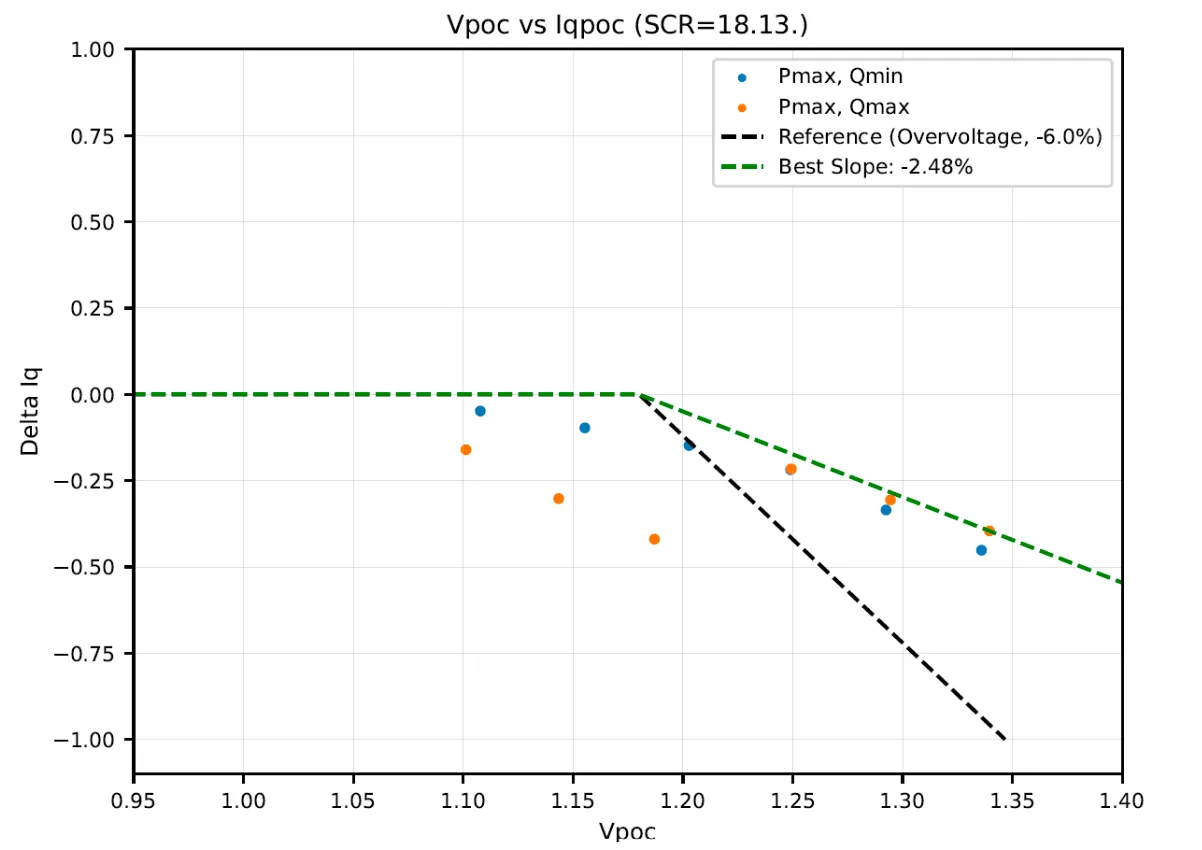
Plots are produced for each test from a high-level choice of channels to display, for example POC voltage, POC reactive power, inverter reactive power and inverter frequency. The suite builds consistently styled, multi-panel figures from that choice. Where required, it calculates and overlays key timing metrics such as rise time, settling time and commencement time. A table of key test data sits alongside the traces, showing the test identifier, platform, operating point, event description, grid strength and initial POC conditions. Figures are then assembled into organised, review-ready documents.